

data driven instruction
BLA focuses on being a data driven, differentiated instruction virtual academy. This means we test students and give individual intervention to bridge the gap to ensure the child is being brought to mastery wherever there are academic gaps. This is done in a fun, innovative, rigorous, and engaging way with the latest PEDAGOGY techniques. This is one of the many ways, we are in a class of our own. There is no other place like BLA!
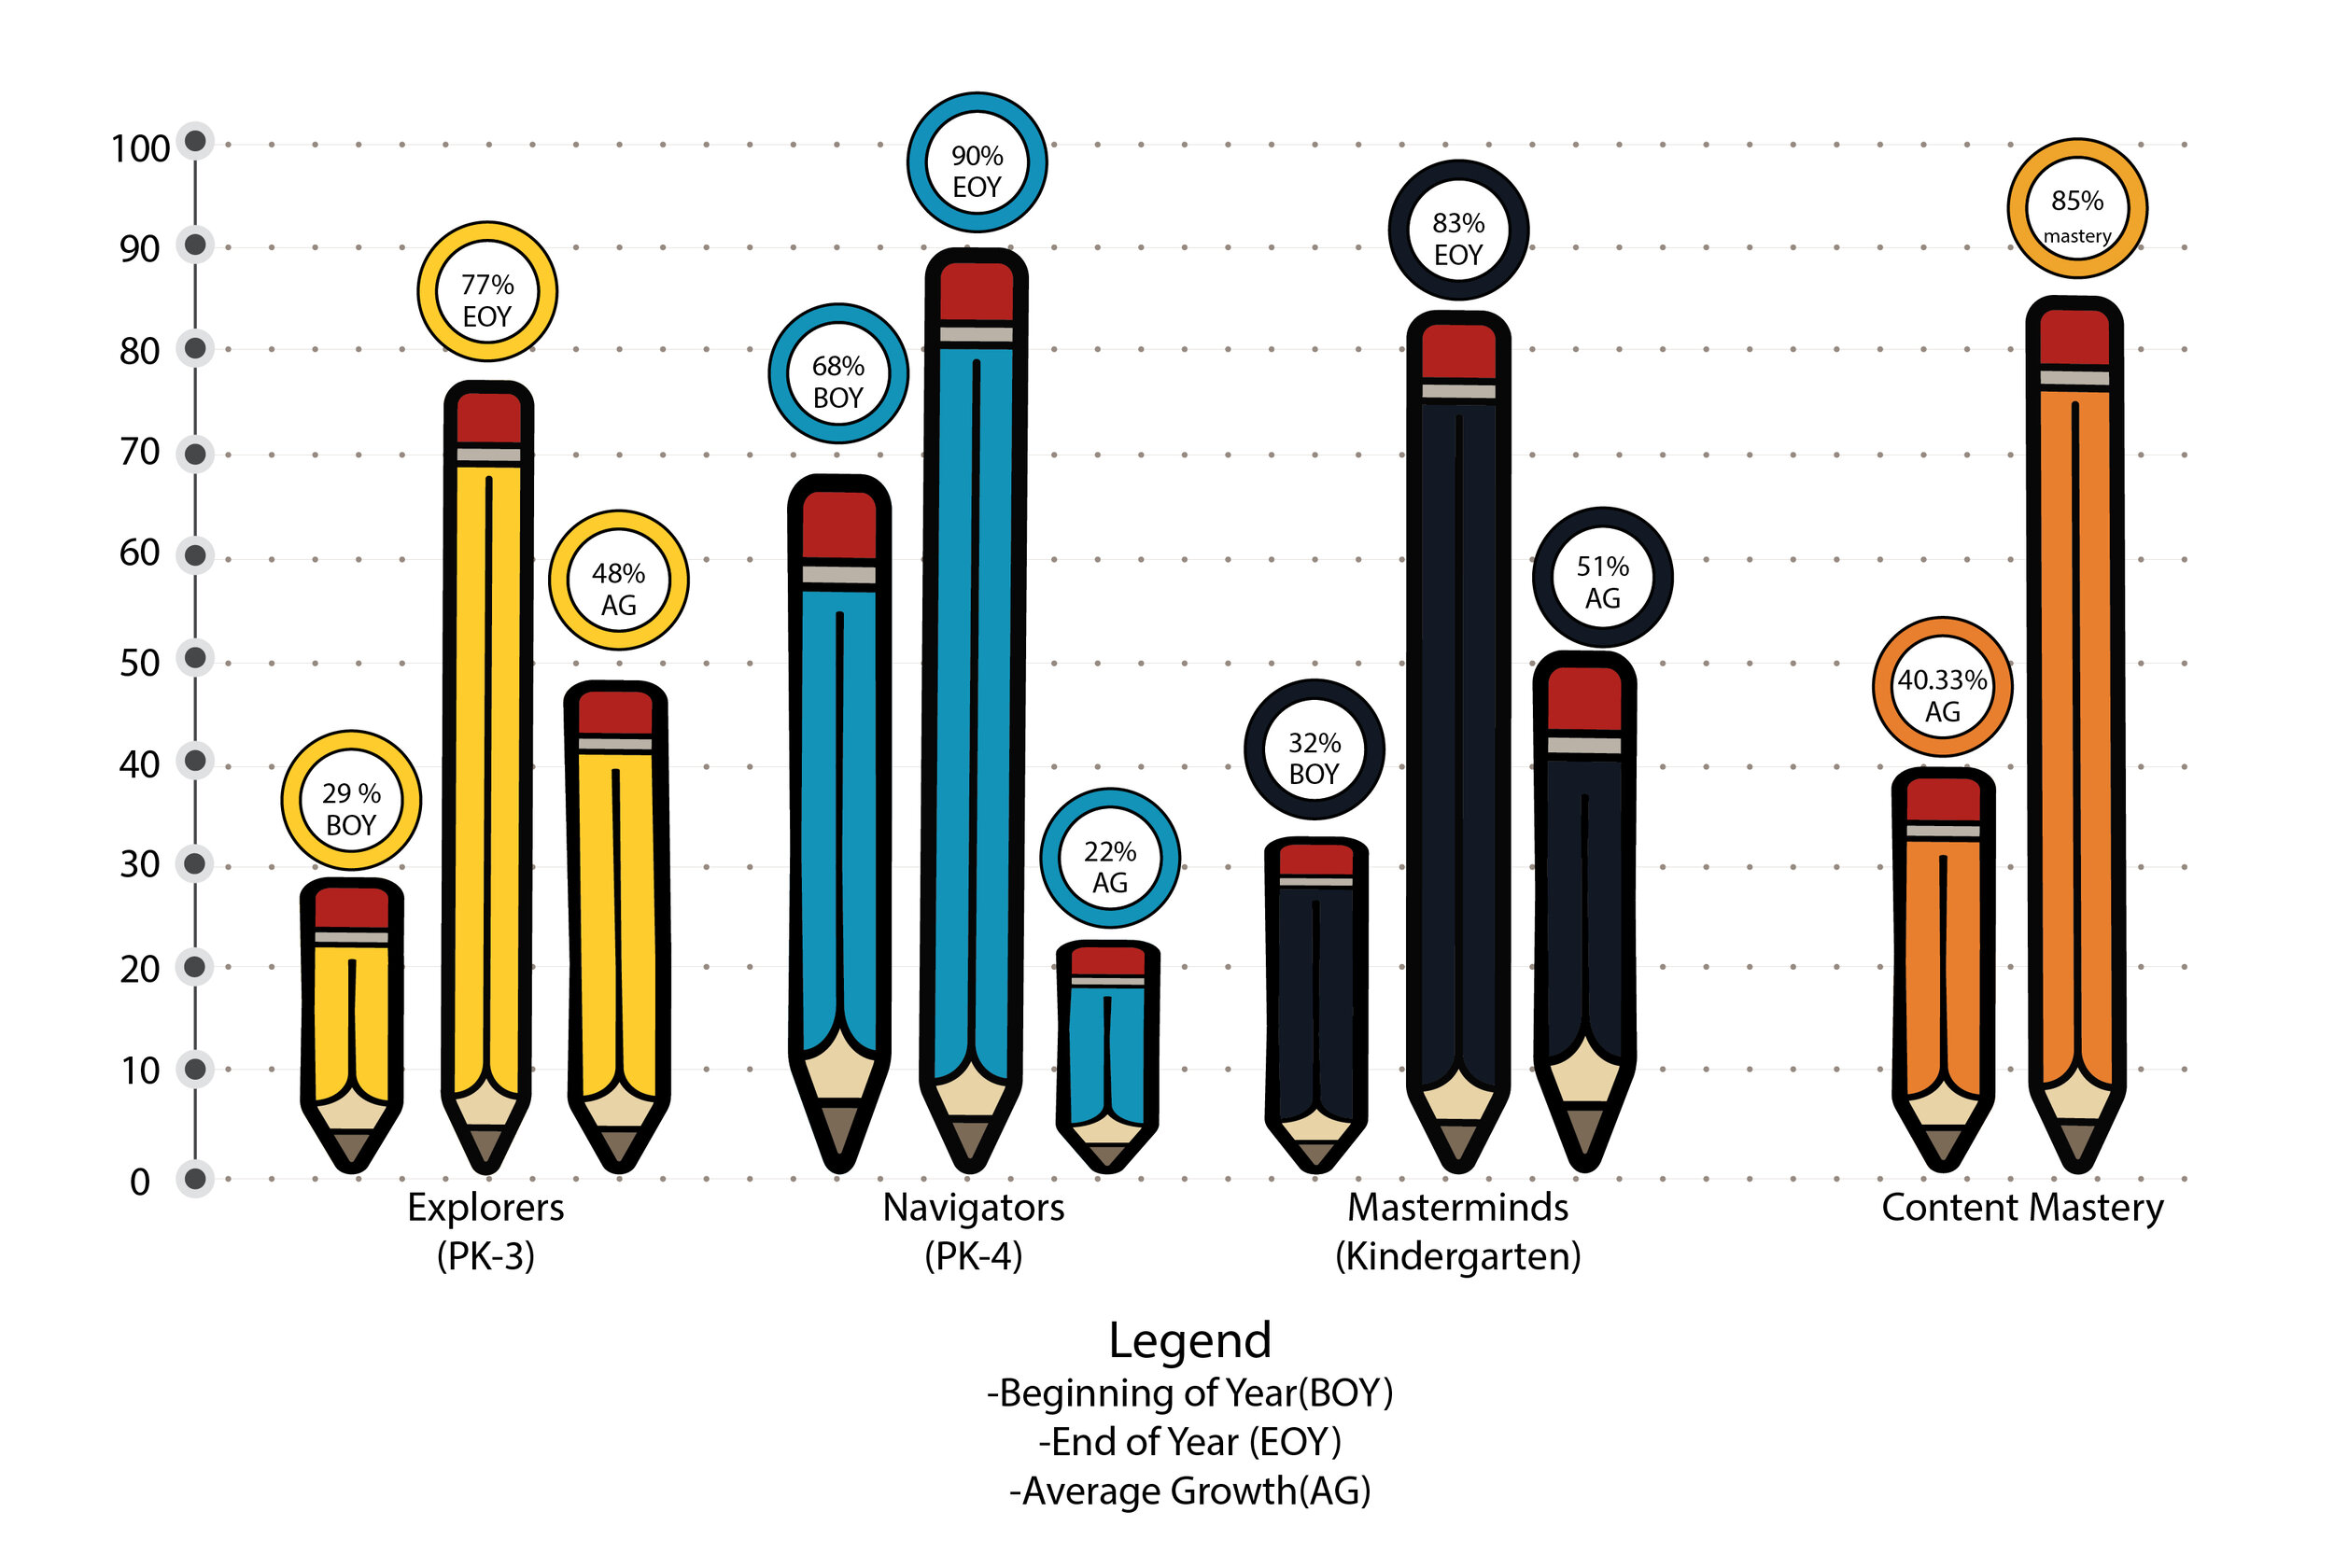
How Do we Know it works?
Average yearly Growth and Content Mastery Data
(2023-2024)

Average yearly Growth and Content Mastery Data
(2022-2023)

Average yearly Growth and Content Mastery Data
(2021-2022)
Average yearly Growth and Content Mastery Data
(2019-2020)
We could not perform our EOY test due to COVID so data is incomplete.
Average yearly Growth and Content Mastery Data
(2018-2019)

Average yearly Growth and Content Mastery Data
(2017-2018)

WHAT A DIFFERENCE THE DATA CAN MAKE!